Just a quick update to announce that a beta version of our project insights dashboard is now available to try. Project insights are designed to give you up-to-date, useful information at a glance about your projects, saving you the hassle of fighting with Excel and other tools.
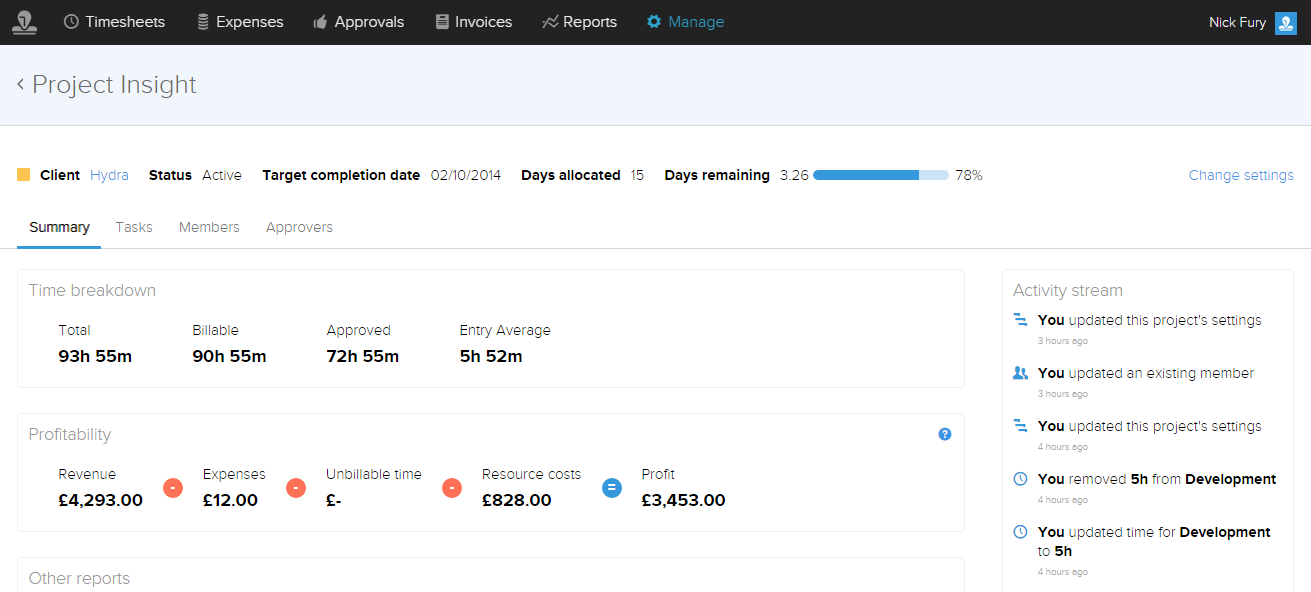
Following on from our previous post, reports, reports, reports, this release lays down the foundations for later releases, specifically a centralised full-screen dashboard containing a number of project related widgets. The project dashboard will eventually become the default view and activity centre for a project. Current widgets include:
- Time breakdown.
- Profitability.
- Activity stream - see what was done on the project, when and by whom.
- Other reports - quickly access all other project reports.
More information can be found here.
We are planning to release new features rapidly over the next few weeks and are looking to get as much feedback as we can. Our current priorities are:
- A project burn down chart and a number of other useful graphs and visualisations for existing date.
- Exposing more rates in the UI. Task and Project revenue rates, and cost rates for a User already exist in the API, but not yet in the UI, meaning less time managing your rates and more time getting work done.
- Unifying the user creation/permission management UI instead of having Members and Approvers.
- Making the App a fullscreen experience everywhere.
- Changes based on YOUR feedback.
Please let us know what you think of the current direction. If you don't already use Timestamp then you can sign up for a free 30-day trial here.